Retail ForesightKnow what is likely to change, and what to do before it does.
Forecast sales, margin, inventory, and cash at the level where retail decisions happen: channel, category, store, product, and SKU. Give finance and merchandising the same forward view, so you can protect margin, release cash, and keep the plan on track.
Sales
See demand changes
Margin
Identify profit exposure
Inventory
Prioritize stock decisions
Cash
Understand capital impact
From signal to decision
Detect the shift. Explain the stakes. Act in time.
A forecast should open a decision window, not just update a spreadsheet. See what is moving, why it matters, and which response best protects the plan.
01
Detect
Surface demand, margin, and inventory shifts early.
02
Explain
Show the drivers and the financial consequence.
03
Act
Compare practical options and see their expected impact before committing.
Built for the retail trade-off
A better outlook is only useful
if it leads to a better decision.
01
Catch the Miss Early
See where sales and demand are moving away from the plan (by channel, category, store, product, and SKU) while there is still time to respond.
02
Protect Margin
Understand pricing, mix, and markdown exposure. Compare the profitability of practical options, not just their sales upside.
03
Put Inventory Cash Back to Work
Locate slow-moving stock and compare transfer, replenishment, and markdown decisions against their working-capital impact.
04
Keep Every Level Reconciled
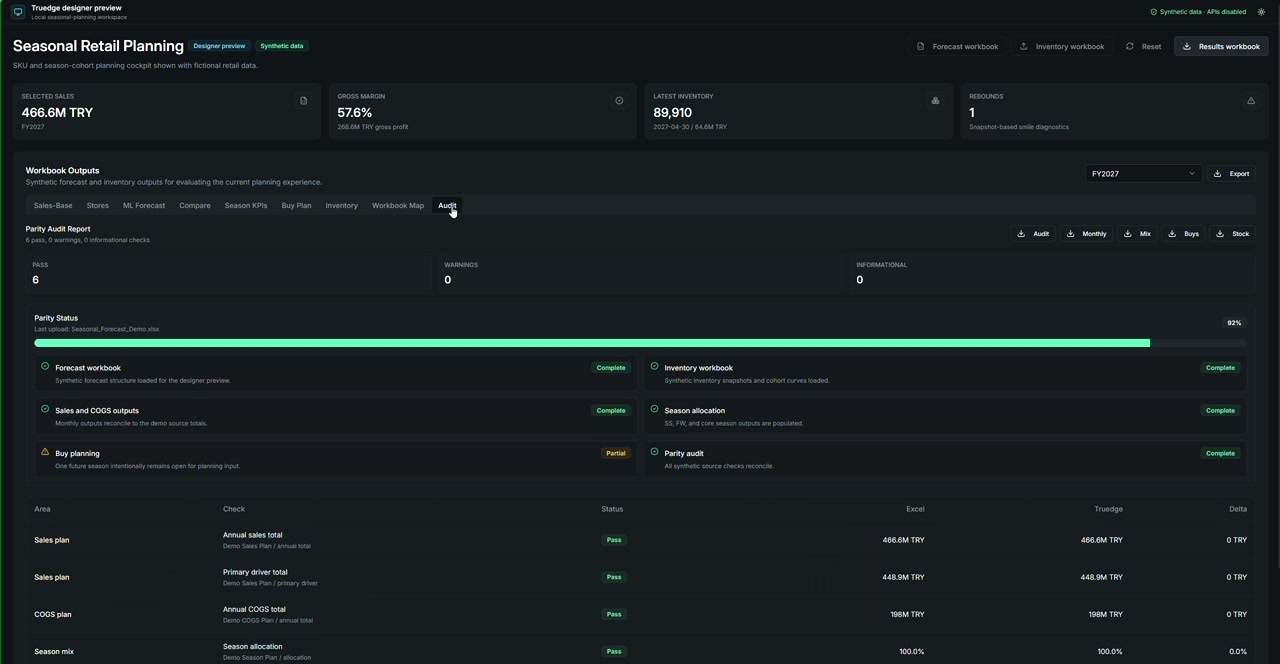
Keep store and SKU decisions connected to the category, channel, and total-company outlook. Work from a plan that adds up at every level.
05
Prove Forecast Reliability
Review historical forecast performance and the range of possible outcomes before committing to a decision.
Validation, not a black box
Proof Behind the Foresight
The outcome comes first. For teams who need to validate it, the methods, uncertainty, and historical performance stay visible.
Trusted figures
Truedge product preview · Synthetic data
Models working together
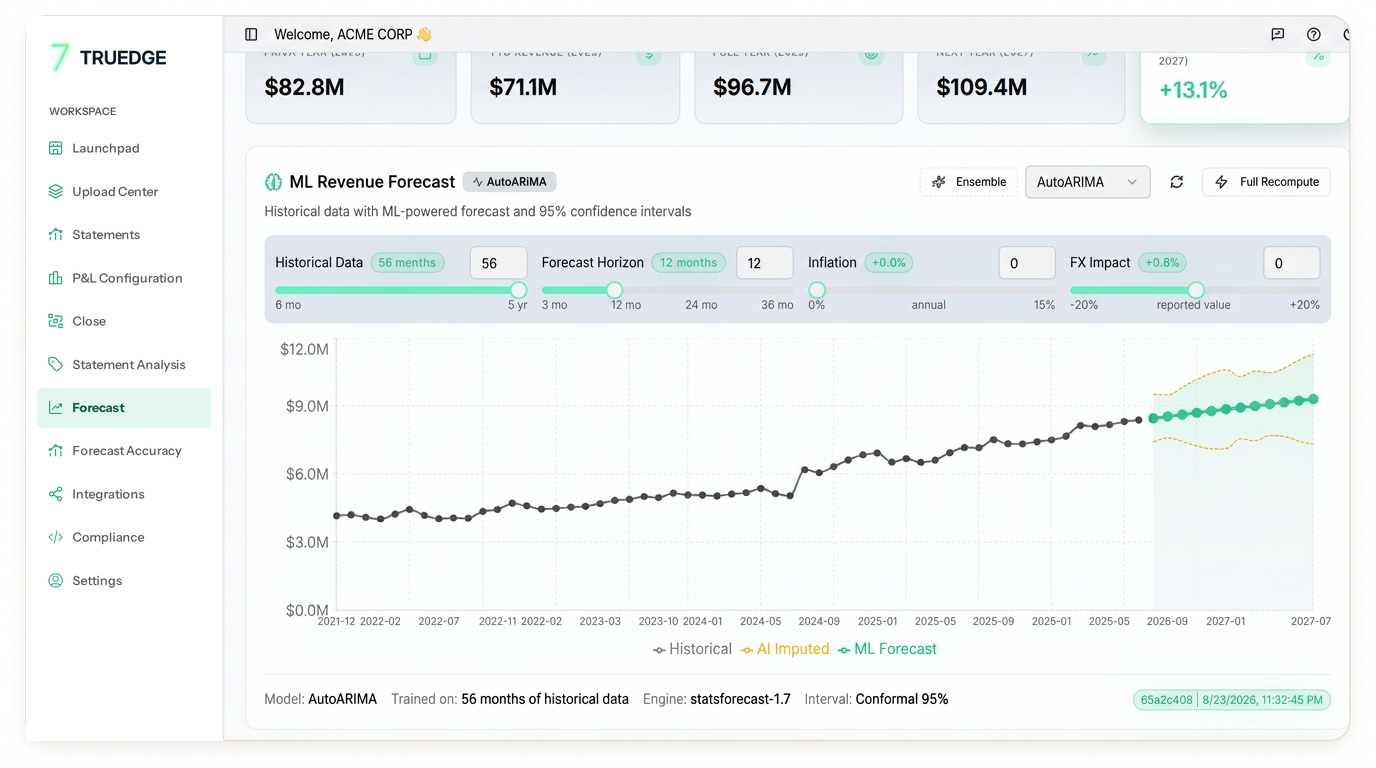
ARIMA, ETS, Prophet, Theta, NNETAR, and STL-based forecasting feed a median ensemble. Statistical and machine-learning approaches support the outlook, rather than replace business judgment.
Uncertainty made visible
Confidence bounds accompany forecasts so teams can evaluate a range, not only a point estimate. Scenario comparisons show the effect of changing assumptions.
Reliability measured over time
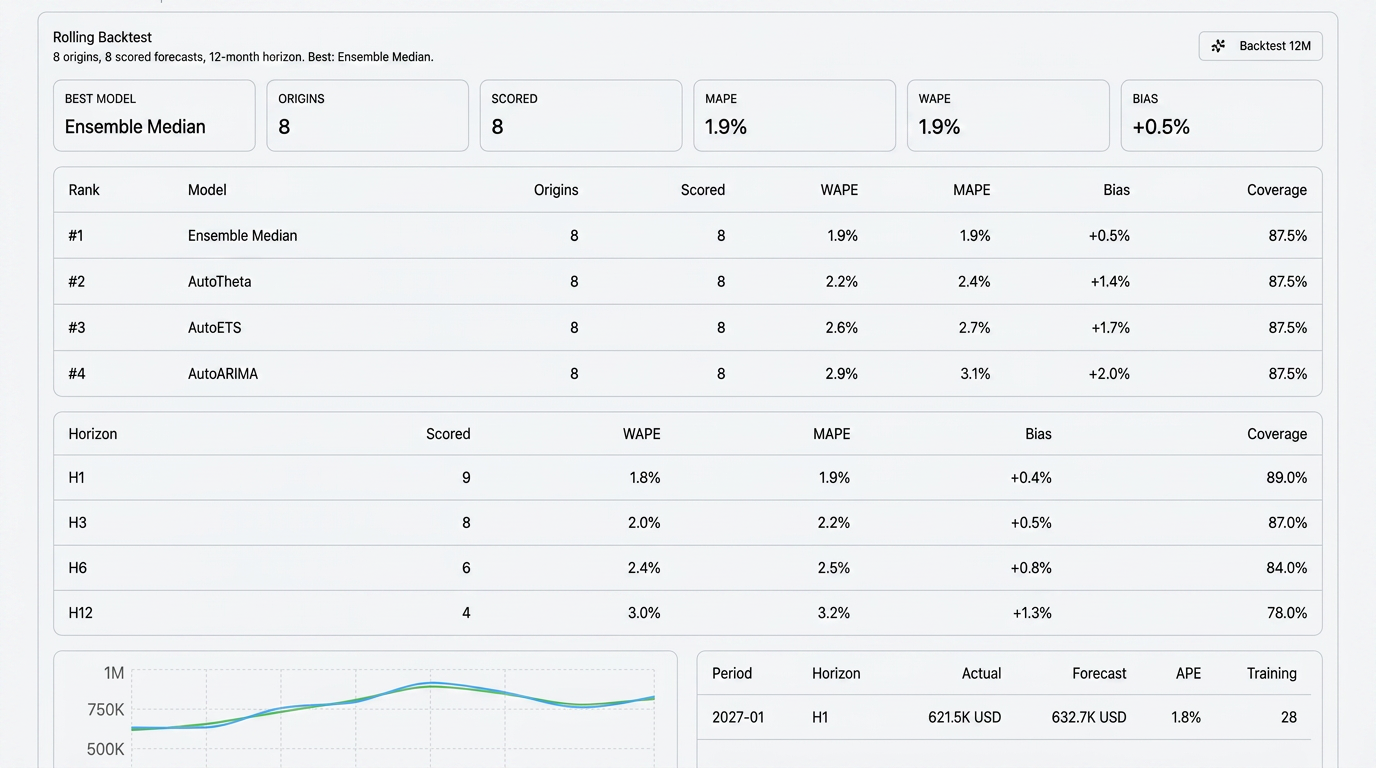
Rolling backtests compare forecasts with historical actuals using MAPE, WAPE, RMSE, bias, and coverage. Performance remains visible alongside the forecast.
One reconciled outlook
Hierarchical reconciliation aligns forecasts across entity, department, and product levels. A minimum of six months of historical revenue supports a 12-month forecast horizon, with gaps addressed through ARIMA-based imputation.